
Bunnelby Common
Buylist Price & Price Trend Chart
VMAX Rising
(Last updated: )
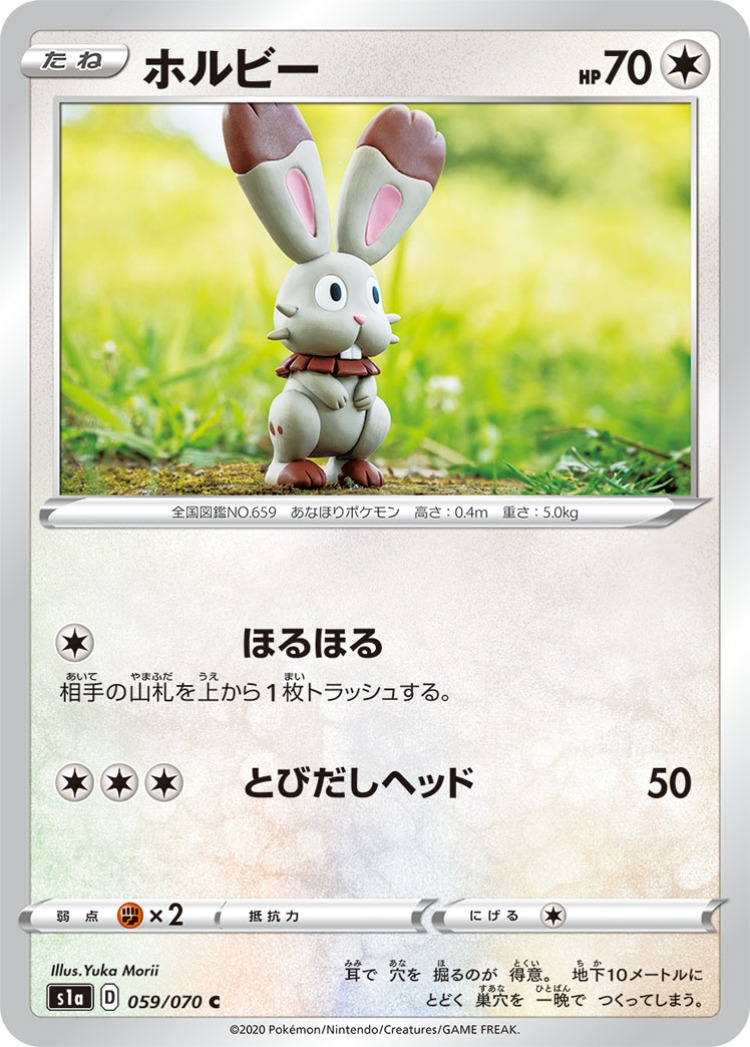
The monthly high for Bunnelby Common from VMAX Rising is ¥105, the monthly low is ¥38, and today's average selling price is ¥95.
This article covers the buylist prices and market data for Bunnelby Common based on data analysis!


Bunnelby Common Price Trend Chart
Bunnelby Common from VMAX Rising is trending up.
Check the chart below to determine the best time to buy or sell.
Monthly Price Increase
+¥57
Monthly Price Decrease
-¥10
| Avg. Price | Date |
|---|---|
| ¥95 | 2026/10/28 |
| ¥77 | 2026/10/27 |
| ¥67 | 2026/10/26 |
| ¥38 | 2026/10/25 |
| ¥50 | 2026/10/24 |
| ¥89 | 2026/10/23 |
| ¥43 | 2026/10/22 |
| ¥105 | 2026/10/21 |
| ¥85 | 2026/10/20 |
| ¥85 | 2026/10/19 |
| ¥42 | 2026/10/18 |
| ¥45 | 2026/10/17 |
| ¥40 | 2026/10/16 |
| ¥93 | 2026/10/15 |
Bunnelby Common Selling Price Info - 6 Shops Compared
| Shop | Price | Updated |
|---|---|---|
| TorecaCamp | $1.14 | 2026/10/27 |
| SurugaYa | $1.01 | 2026/10/28 |
| HareruYa2 | $0.32 | 2026/10/27 |
| KanaBell | $0.29 | 2026/10/27 |
| YuYuTei | $0.19 | 2026/10/27 |
| CardRush | $0.19 | 2026/10/28 |
The highest selling price for Bunnelby Common is ¥180 at TorecaCamp, and the lowest is ¥30 at CardRush.
VMAX Rising - Other Common
-
Toxel
Common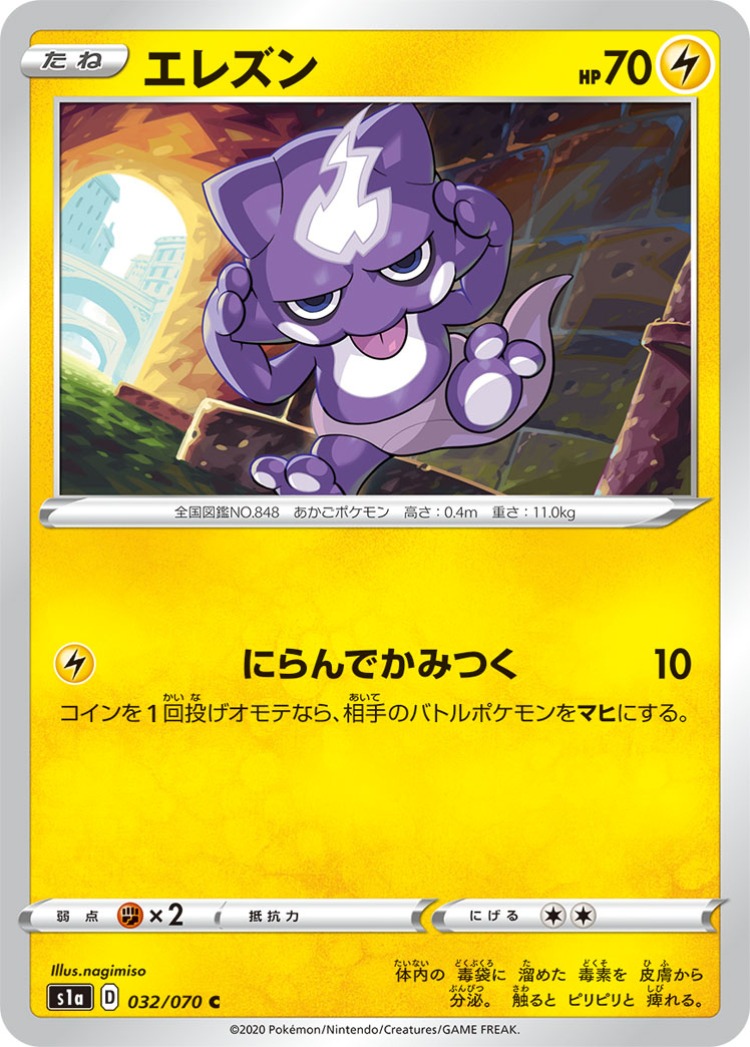
Avg. Price $0.19
-
Heliolisk
Common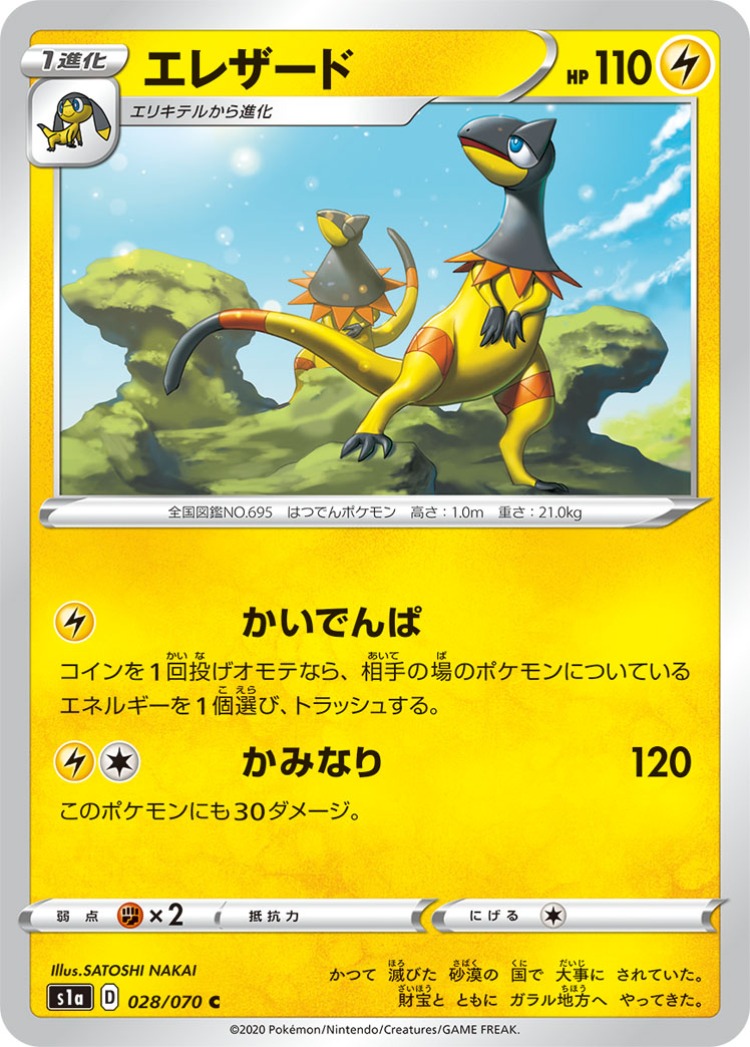
Avg. Price $0.19
-
Indeedee
Common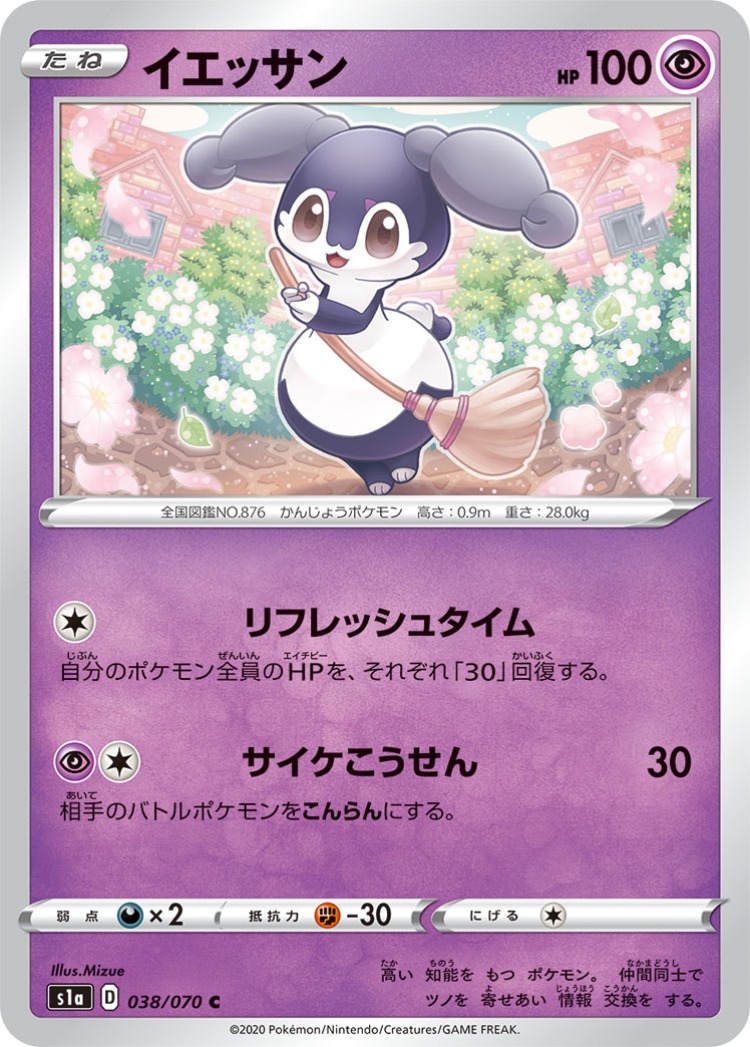
Avg. Price $0.19
-
Hawlucha
Common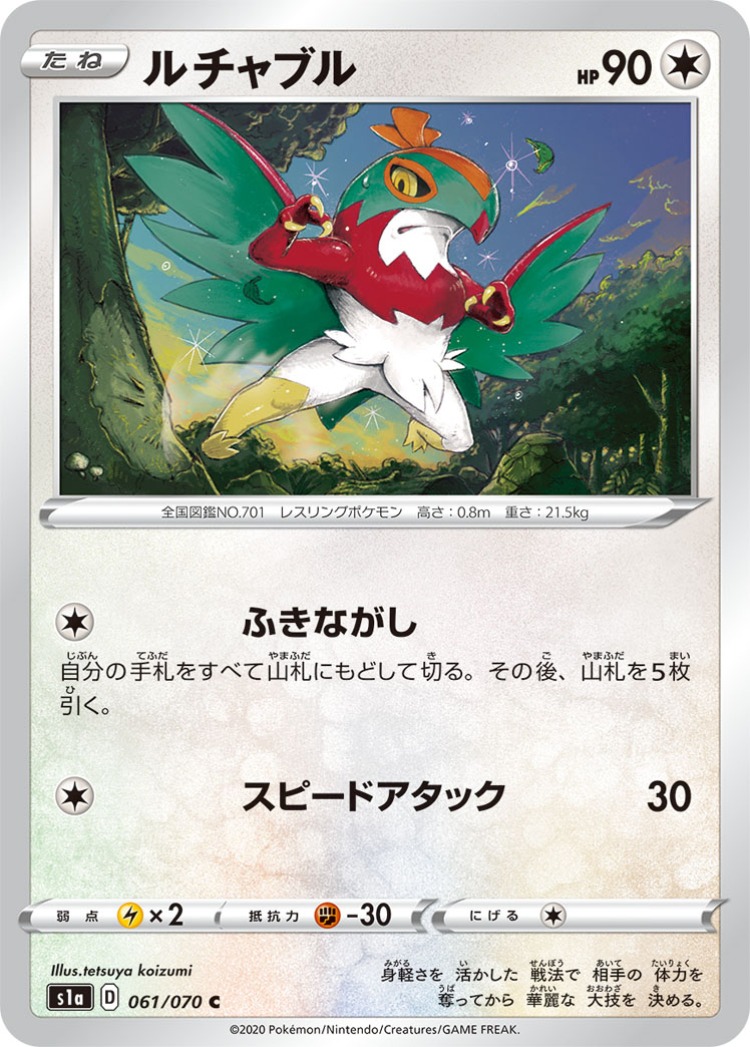
Avg. Price $0.40
-
Galarian Mr. Mime
Common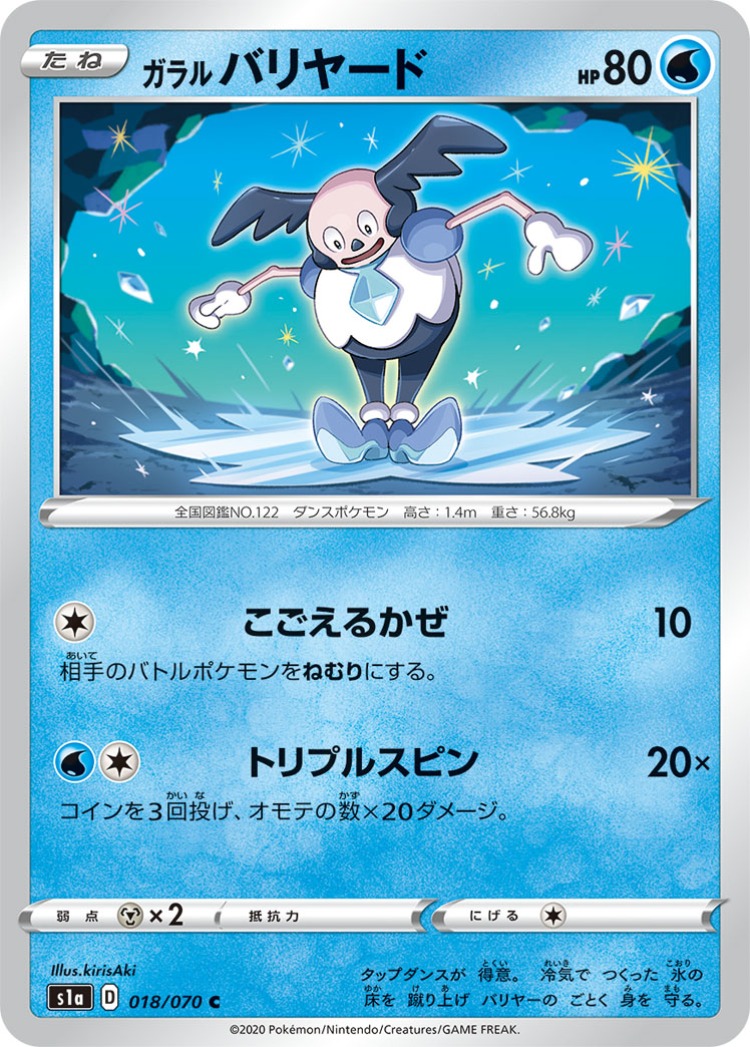
Avg. Price $0.37
-
Vulpix
Common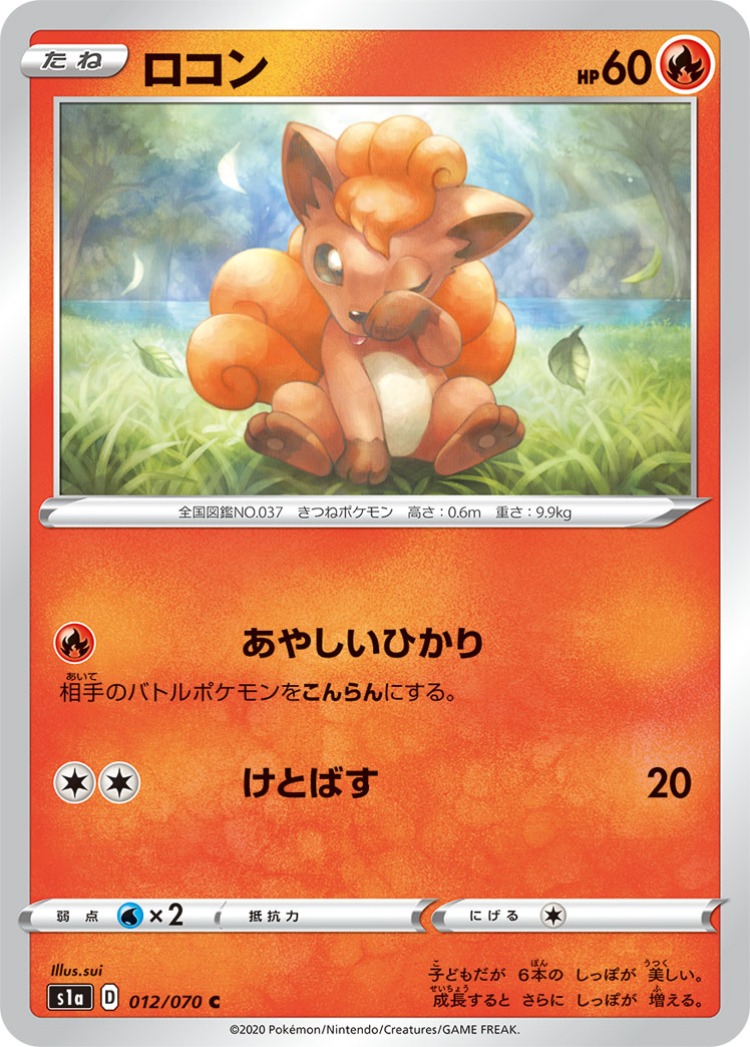
Avg. Price $0.30
-
Growlithe
Common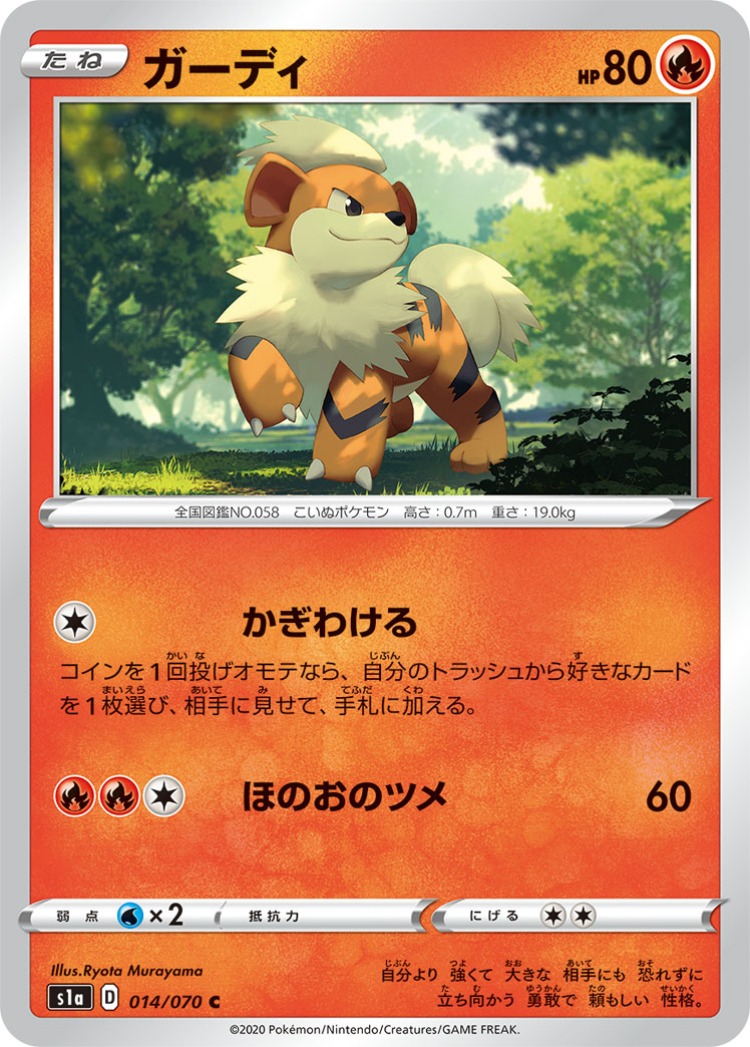
Avg. Price $0.59
-
Grubbin
Common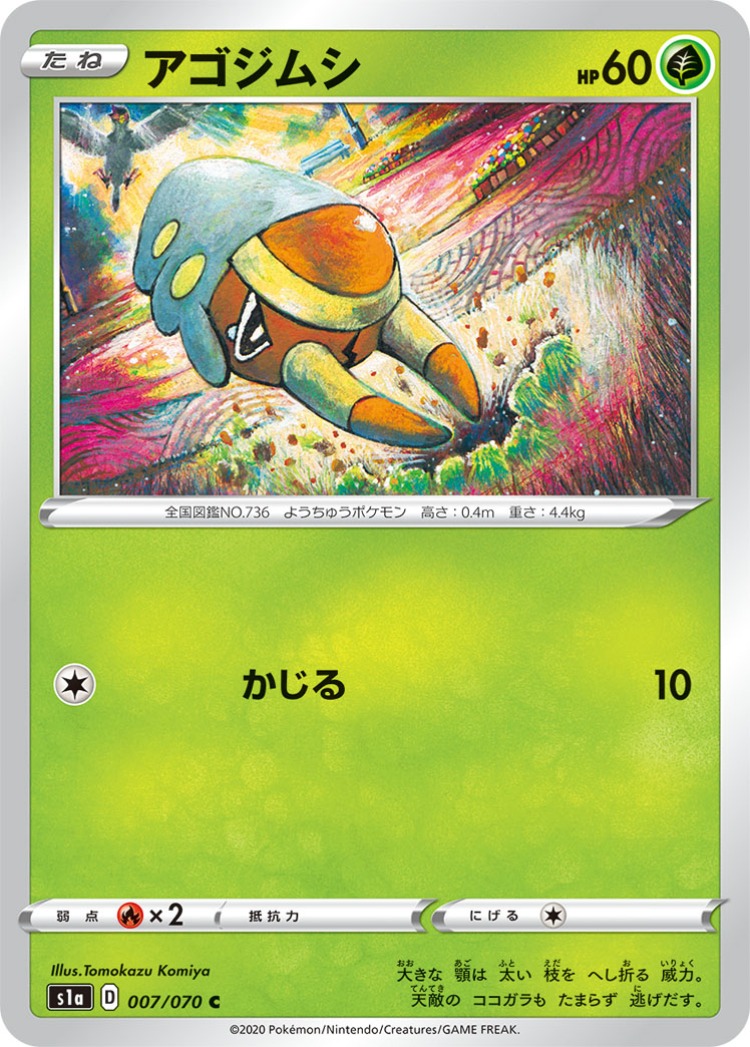
Avg. Price $0.40
-
Dreepy
Common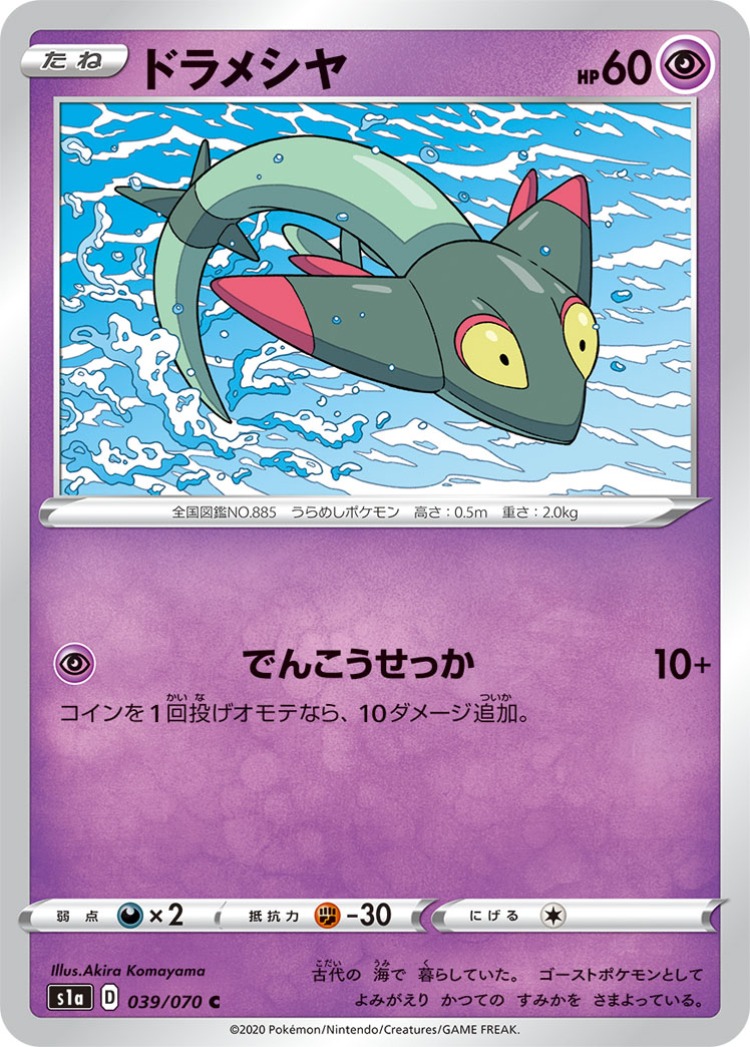
Avg. Price $0.19
-
Caterpie
Common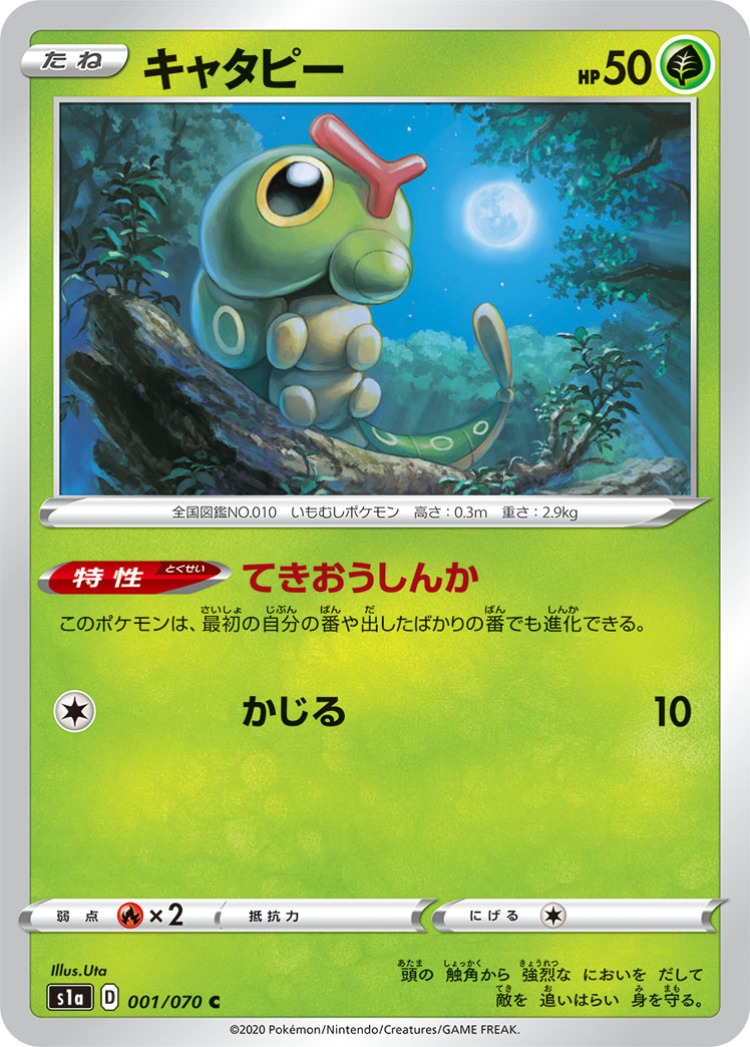
Avg. Price $0.56
-
Binacle
Common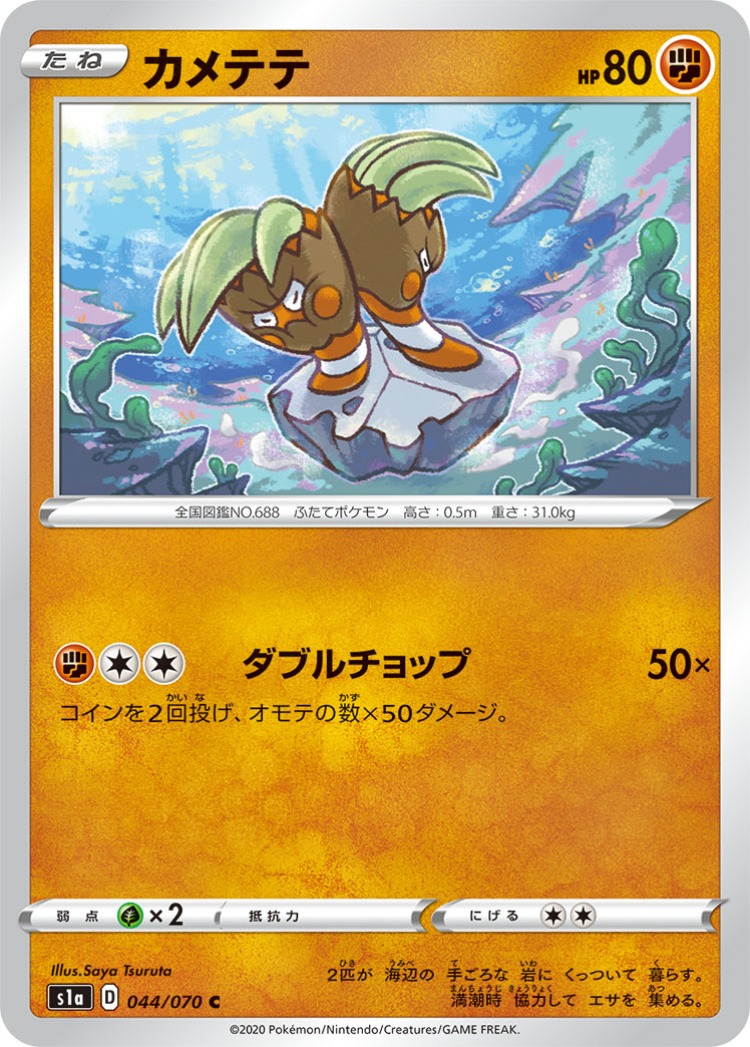
Avg. Price $0.19
-
Arrokuda
Common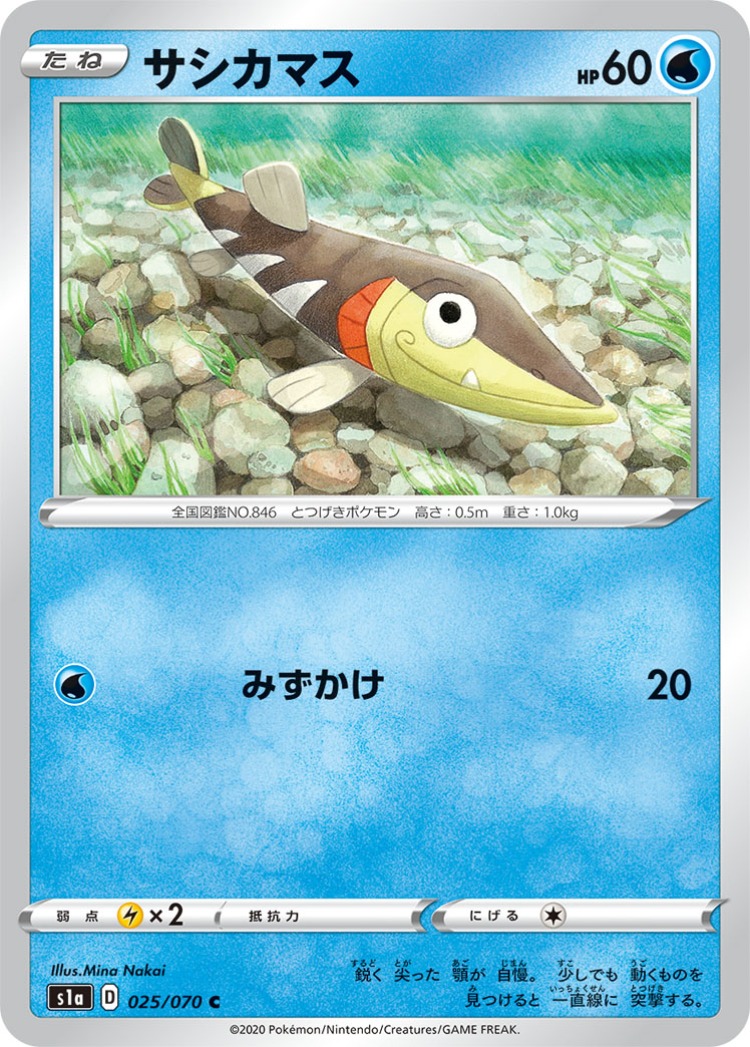
Avg. Price $0.62
-
Helioptile
Common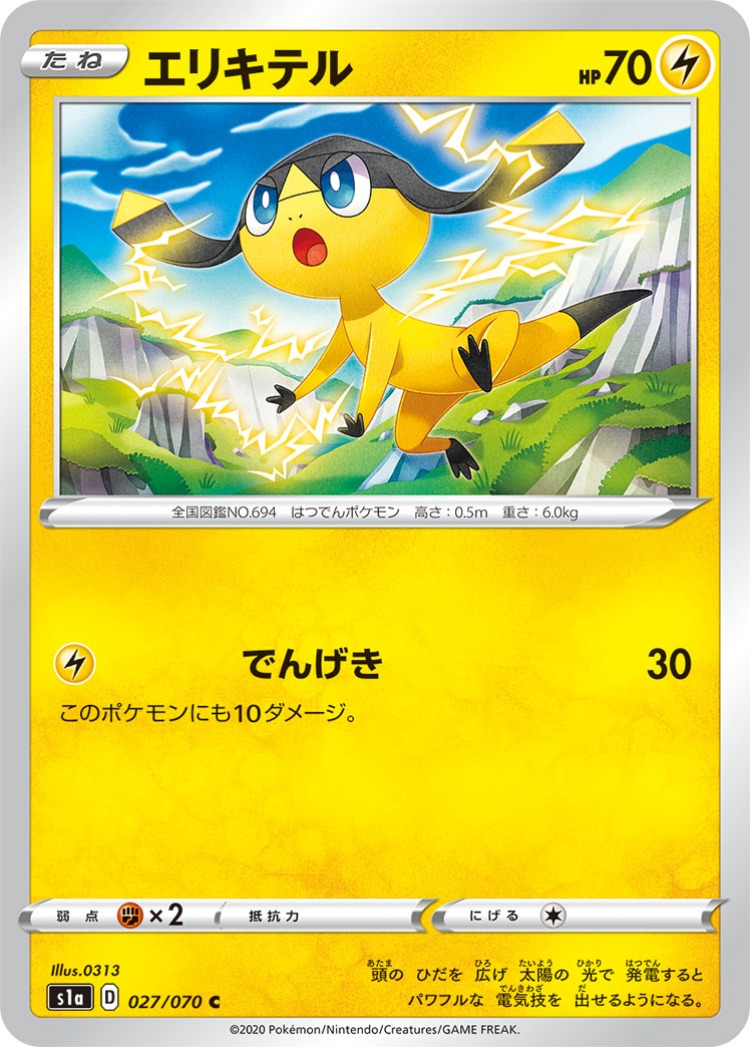
Avg. Price $0.16
-
Stunky
Common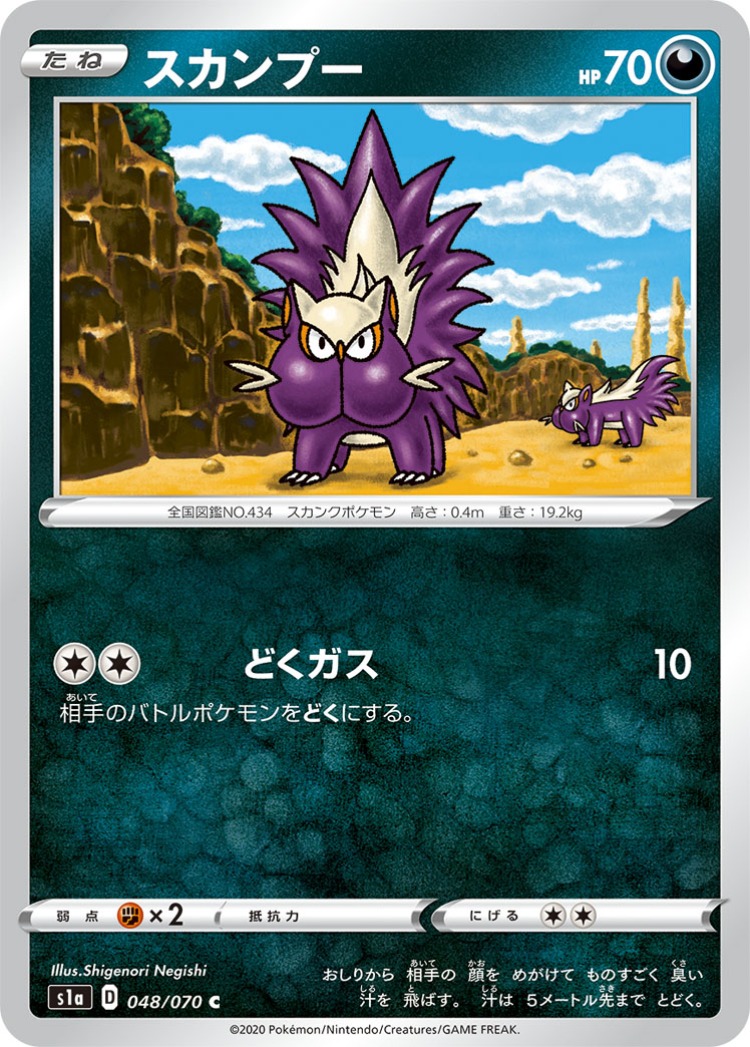
Avg. Price $0.40
-
Falinks
Common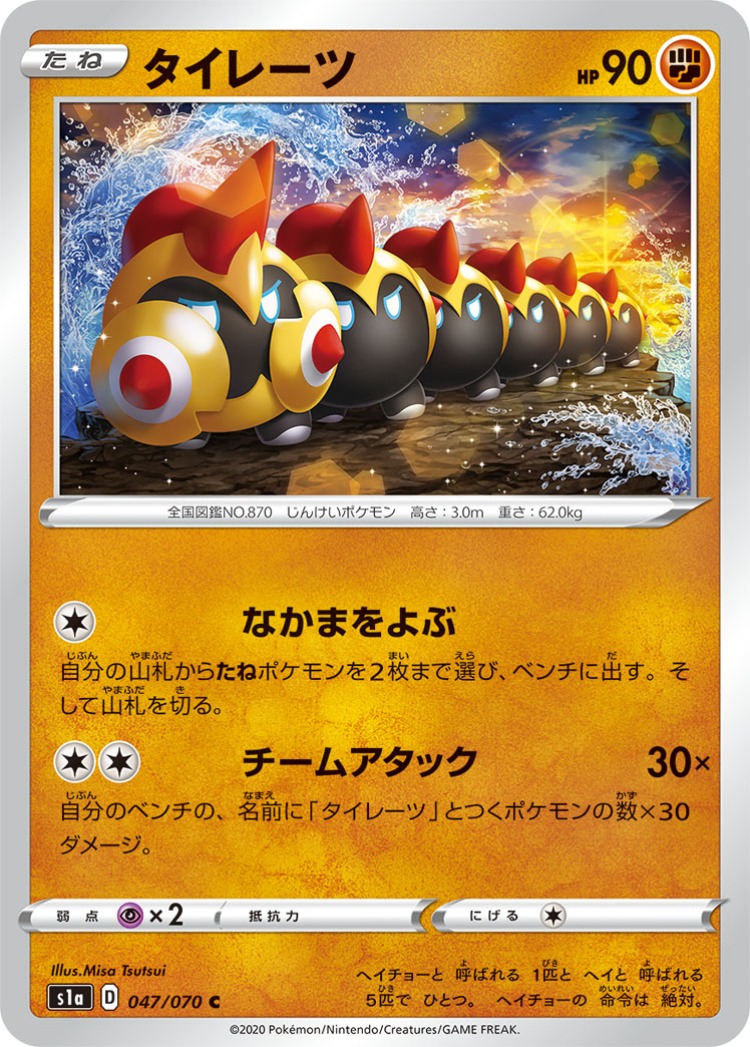
Avg. Price $0.67
-
Magikarp
Common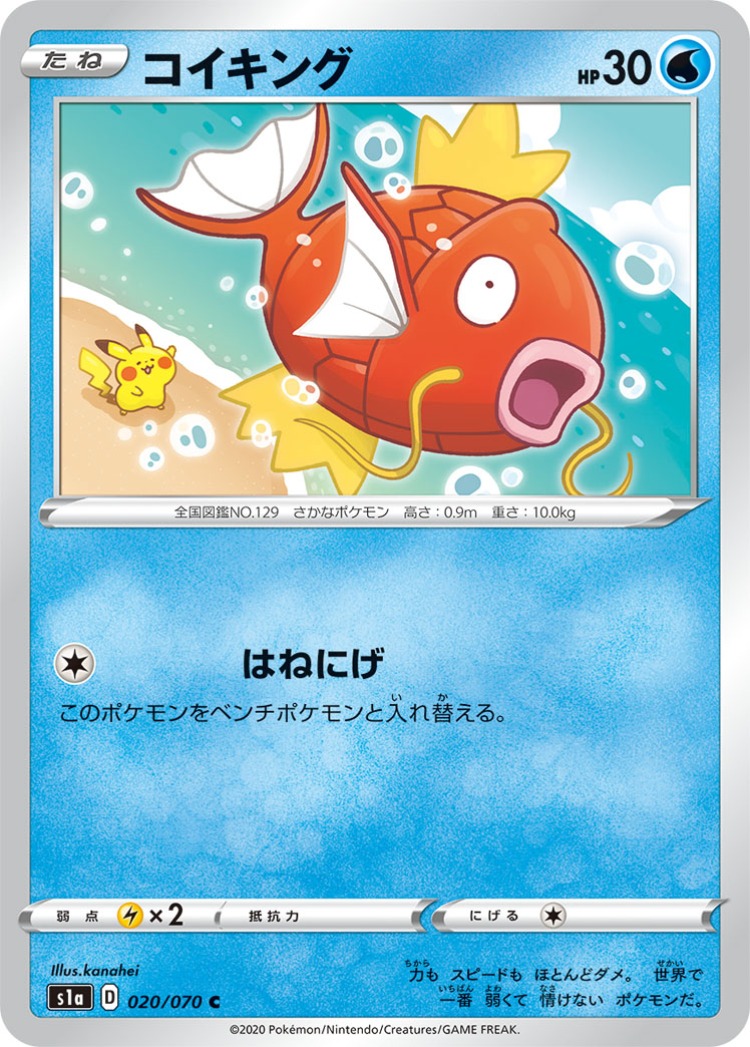
Avg. Price $3.68
-
Drakloak
Common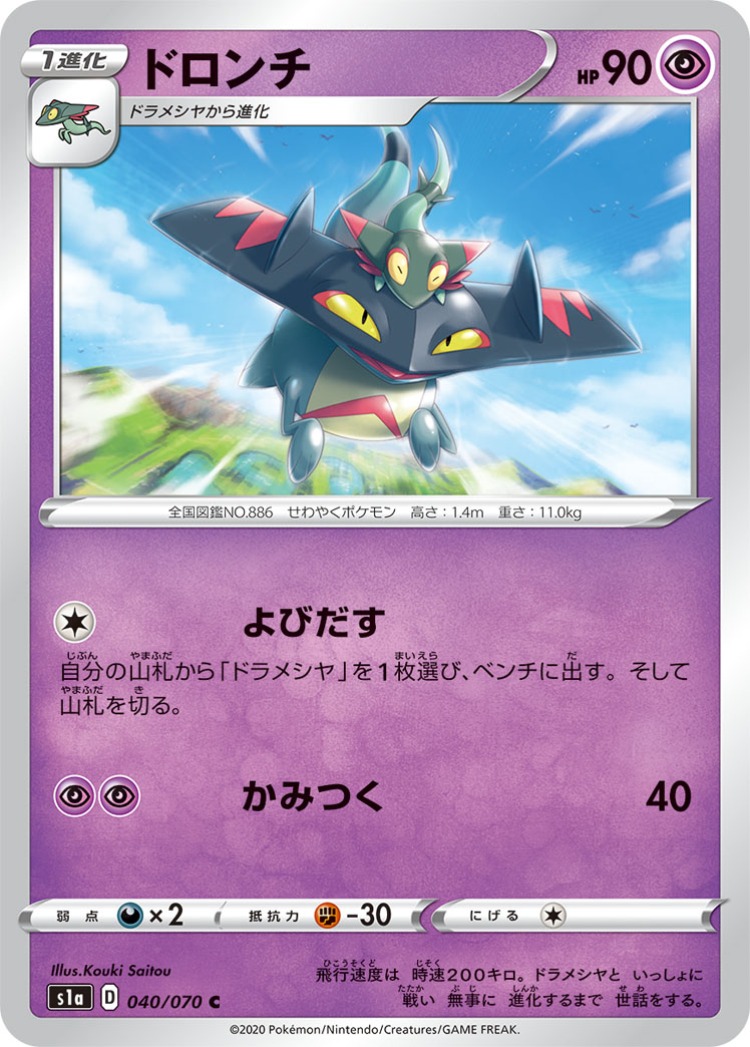
Avg. Price $0.46
-
Natu
Common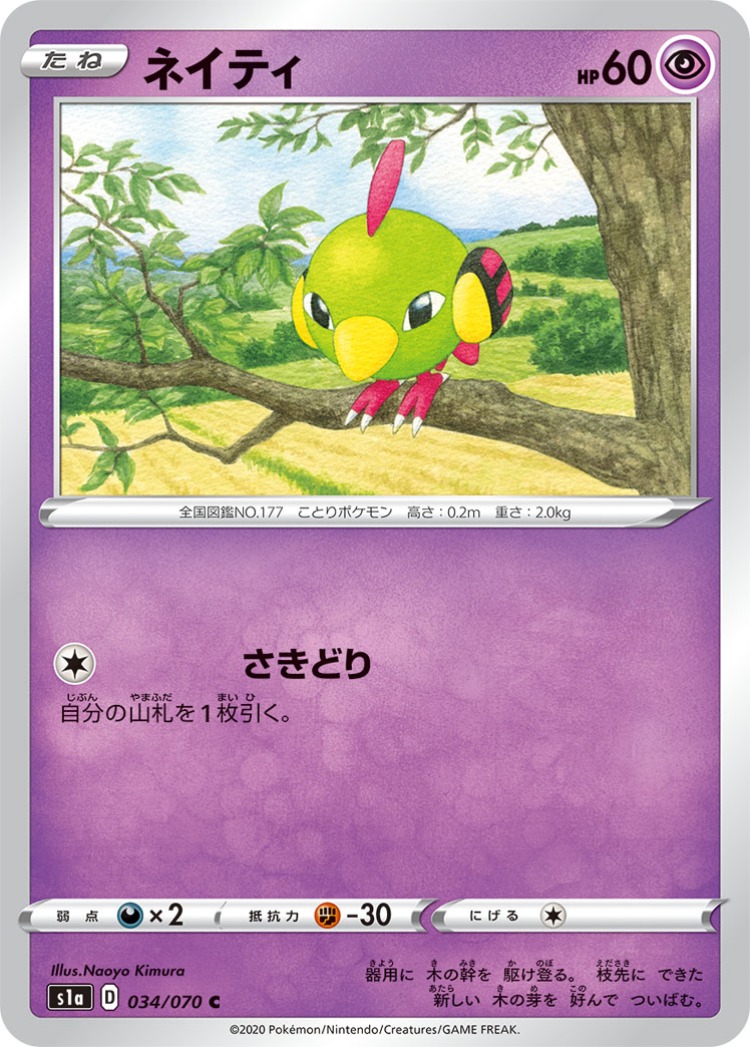
Avg. Price $0.19
-
Morgrem
Common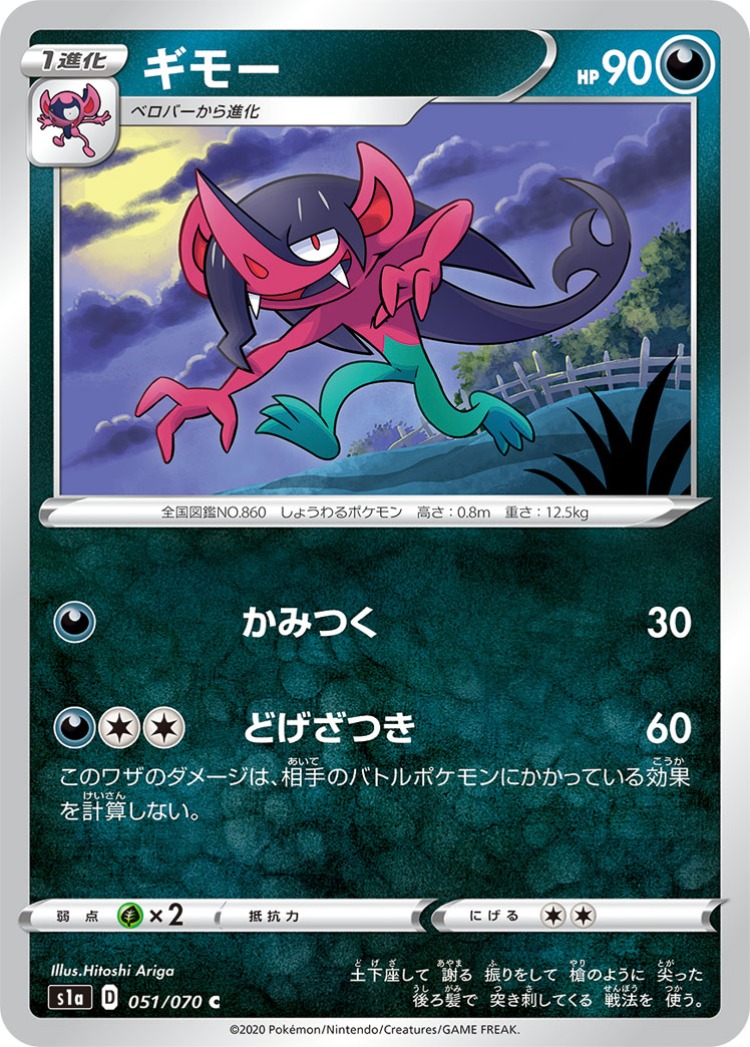
Avg. Price $0.40
-
Honedge
Common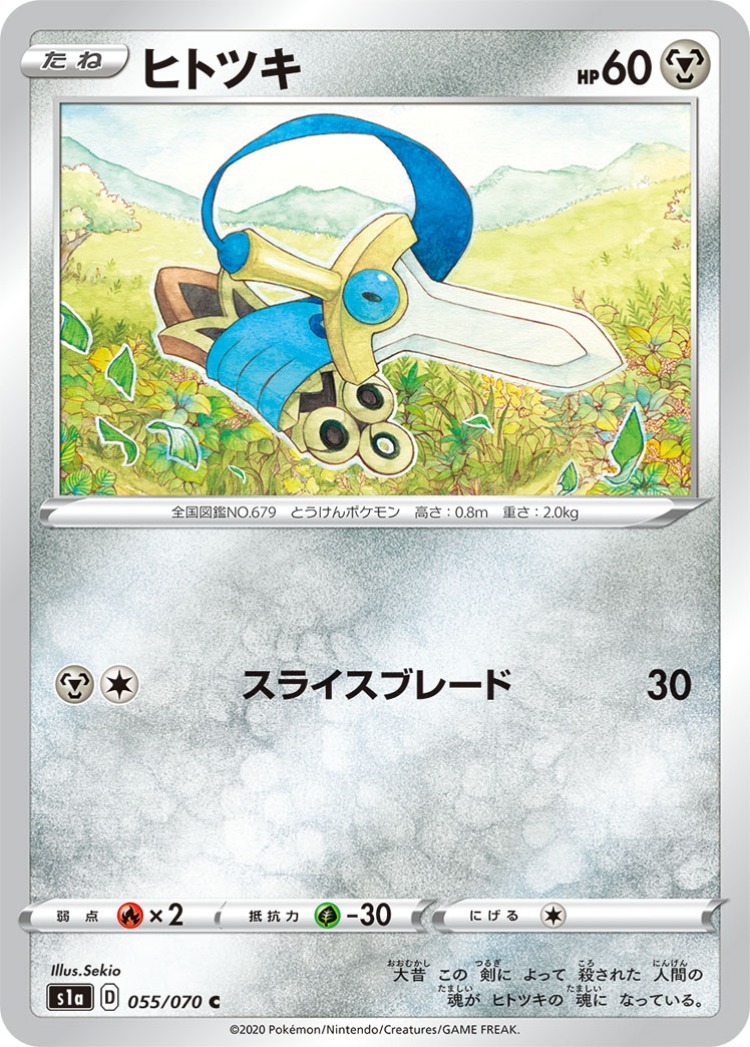
Avg. Price $0.22
-
Metapod
Common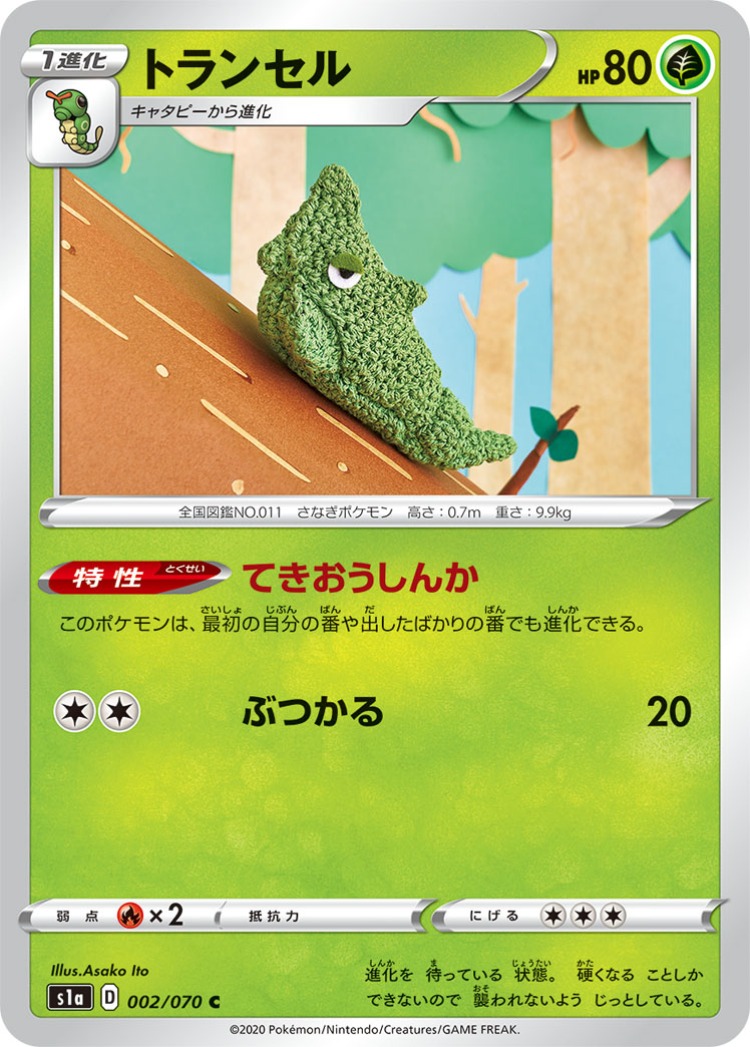
Avg. Price $0.32
-
Galarian Farfetch'd
Common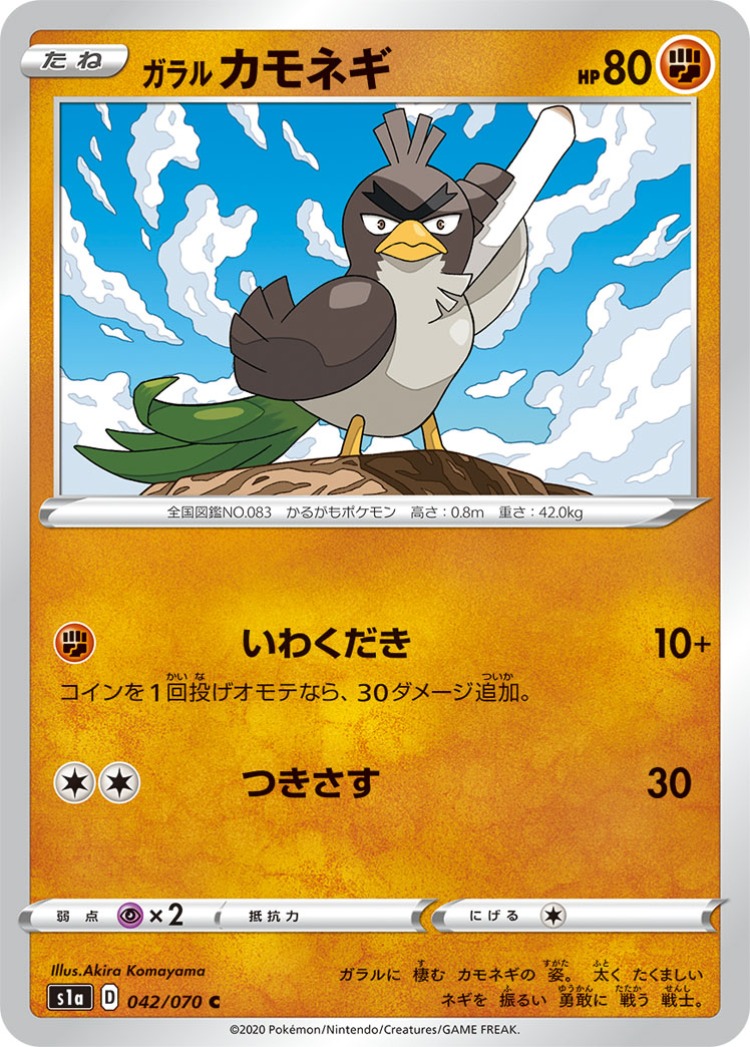
Avg. Price $0.20
-
Charjabug
Common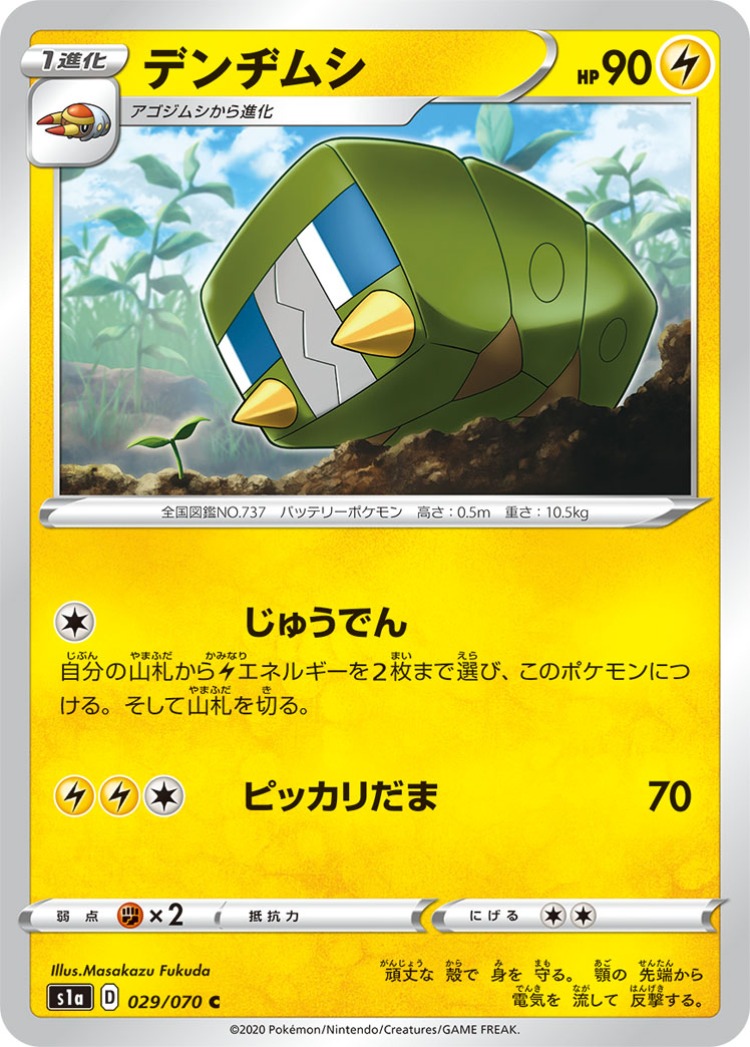
Avg. Price $0.60
-
Impidimp
Common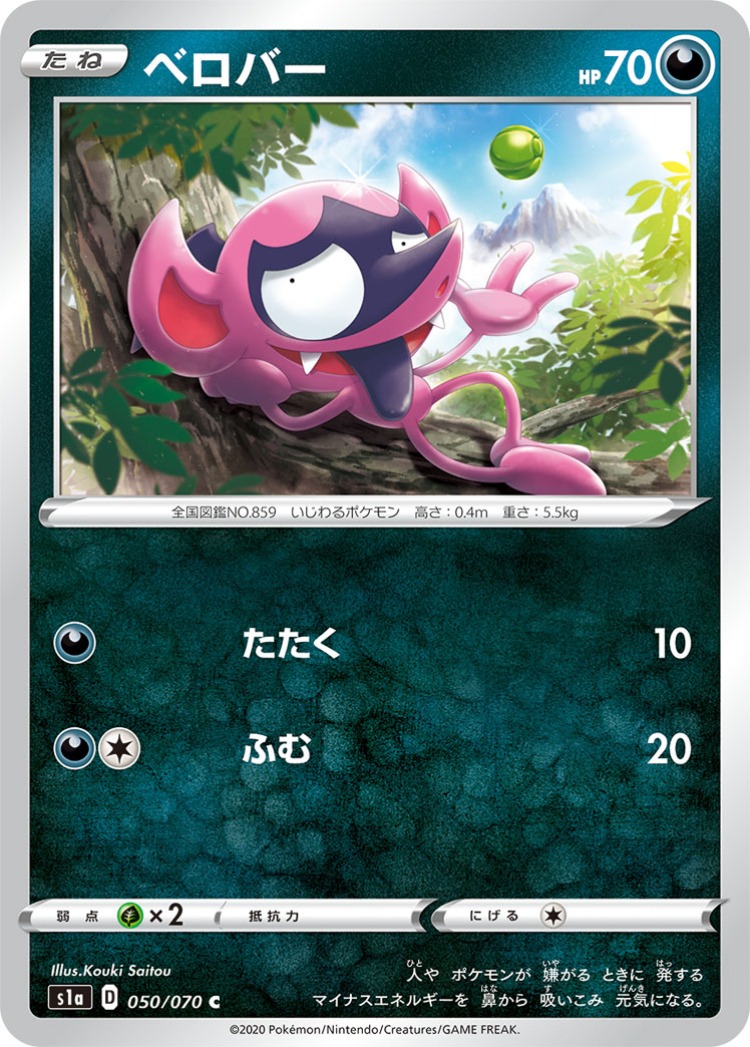
Avg. Price $0.19
-
Applin
Common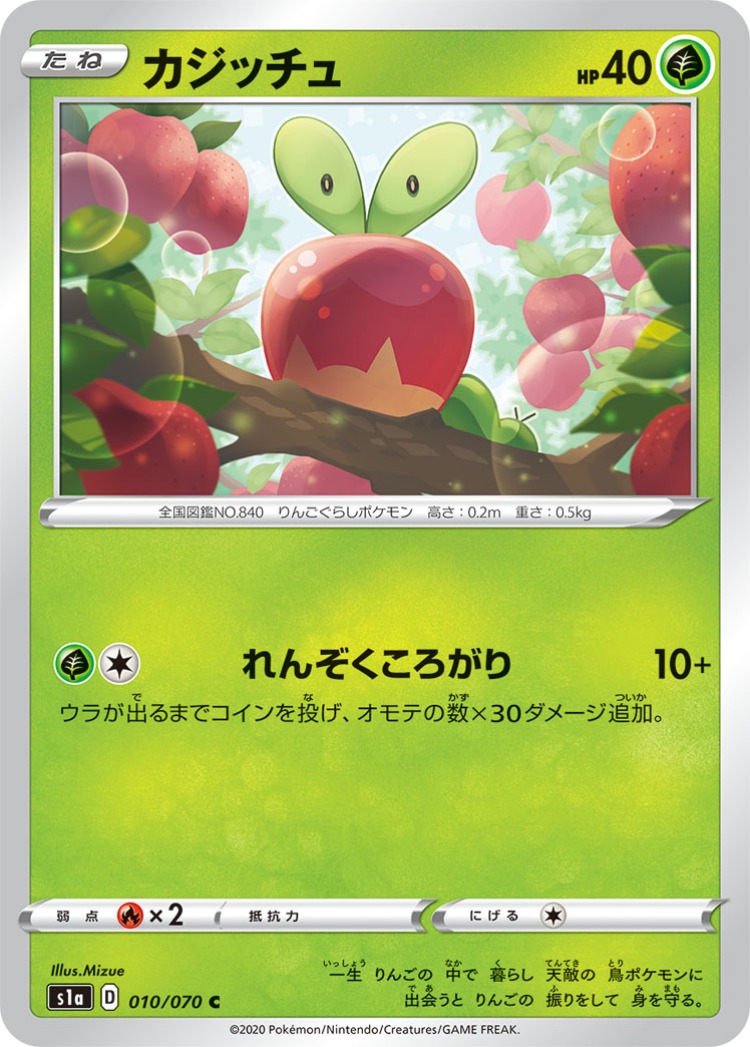
Avg. Price $1.86
-
Doublade
Common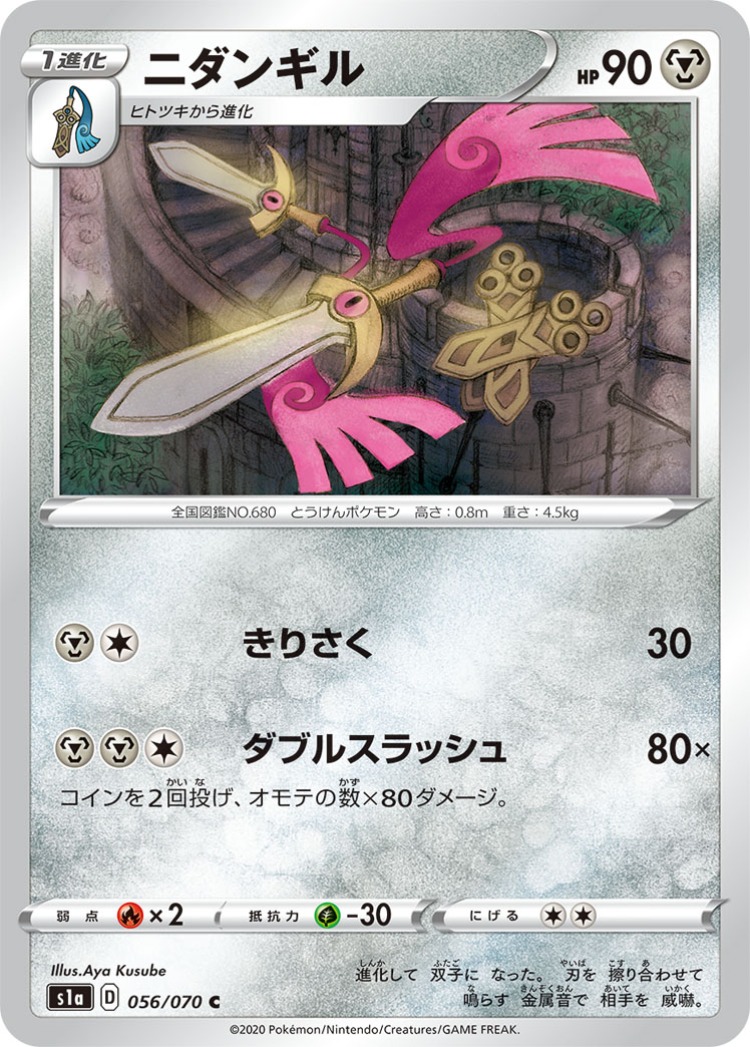
Avg. Price $0.67
-
Snover
Common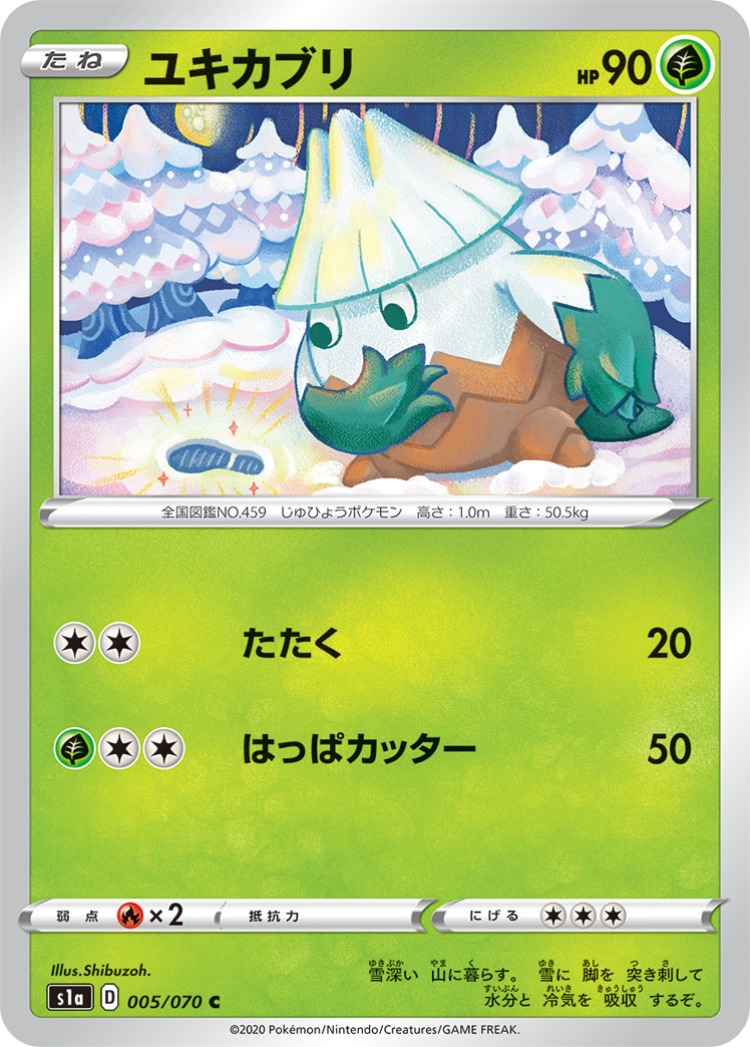
Avg. Price $0.19
-
Bronzor
Common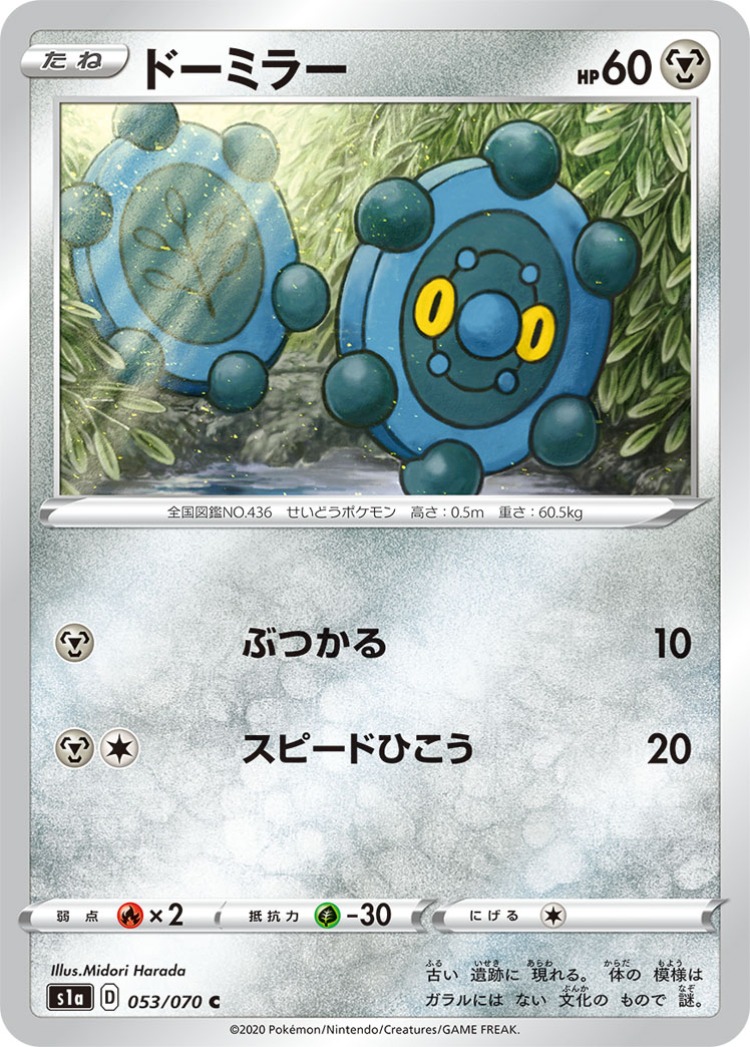
Avg. Price $0.49
-
Galarian Corsola
Common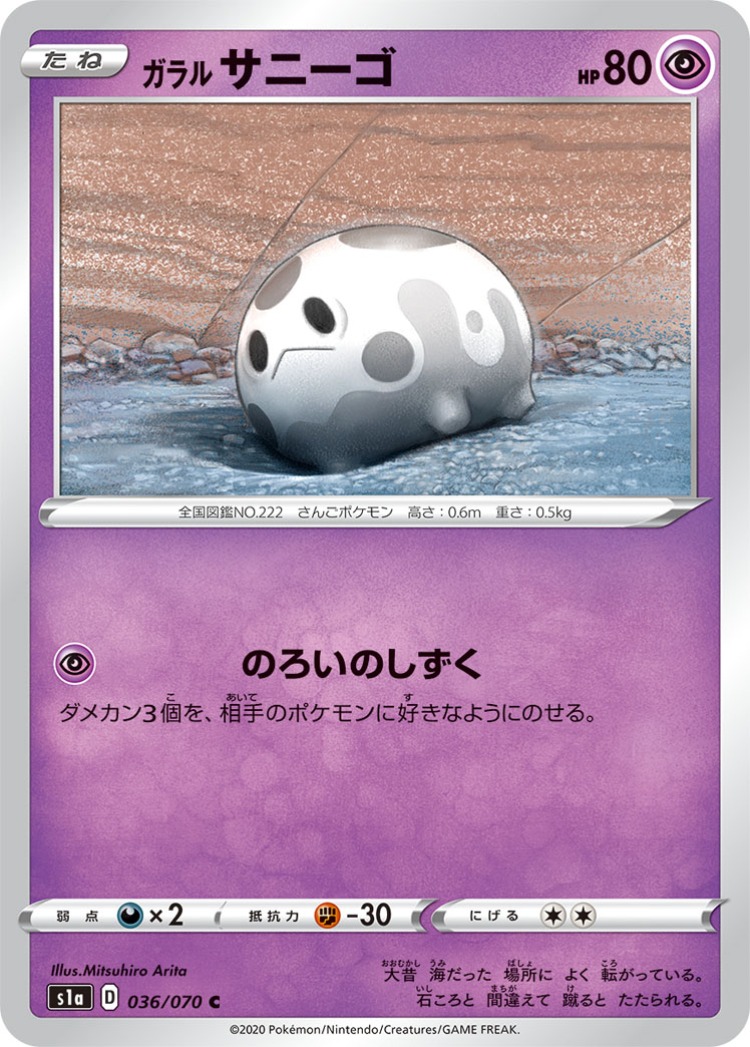
Avg. Price $0.24
VMAX Rising Chase Card Most Expensive Rankings
-
#1
Sonia
Super Rare

Avg. Price $138.13
-
#2
Sonia
Hyper Rare

Avg. Price $24.08
-
#3
Frosmoth
Ultra Rare

Avg. Price $13.86
-
#4
big charm
Ultra Rare

Avg. Price $10.69
-
#5
Twin Energy
Ultra Rare

Avg. Price $10.65
-
#6
Cinderace VMAX
Hyper Rare

Avg. Price $8.74
-
#7
Inteleon VMAX
Hyper Rare

Avg. Price $8.43
-
#8
Rillaboom VMAX
Hyper Rare

Avg. Price $8.11
-
#9
Inteleon V
Super Rare

Avg. Price $5.26
-
#10
Cinderace V
Super Rare

Avg. Price $3.99
